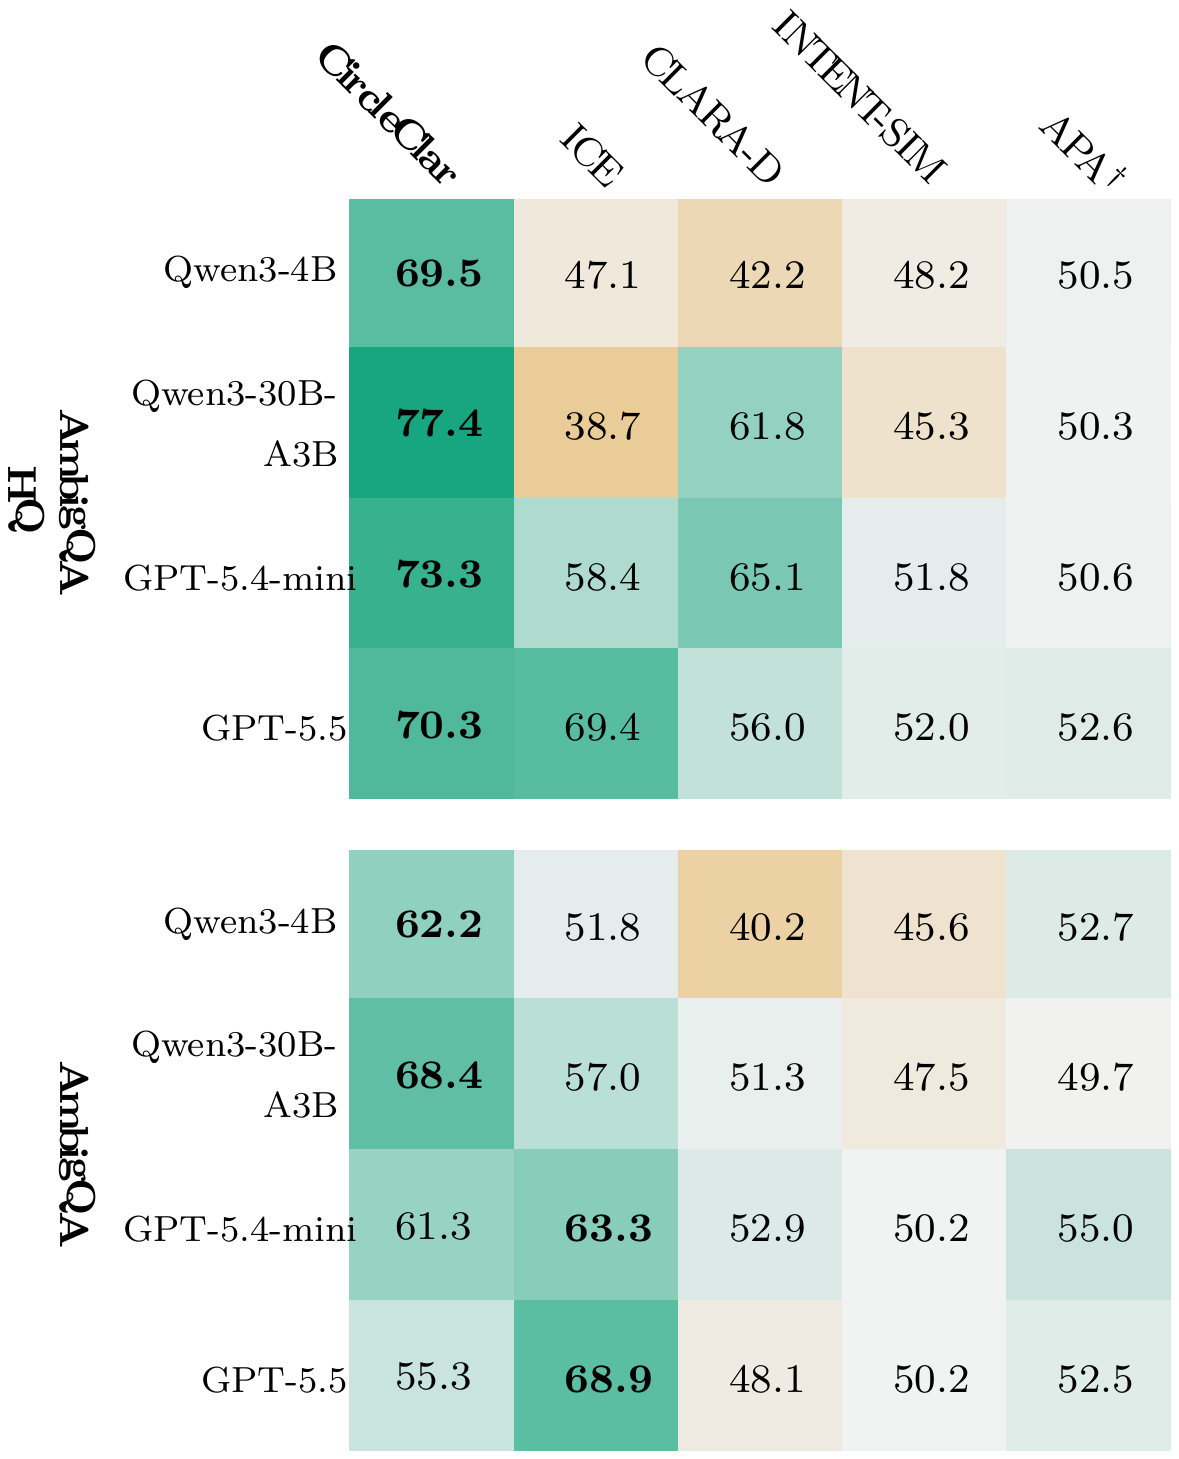
Recovering model-realizable answers
Set F1 ± std. / EM (%) · best · second-best
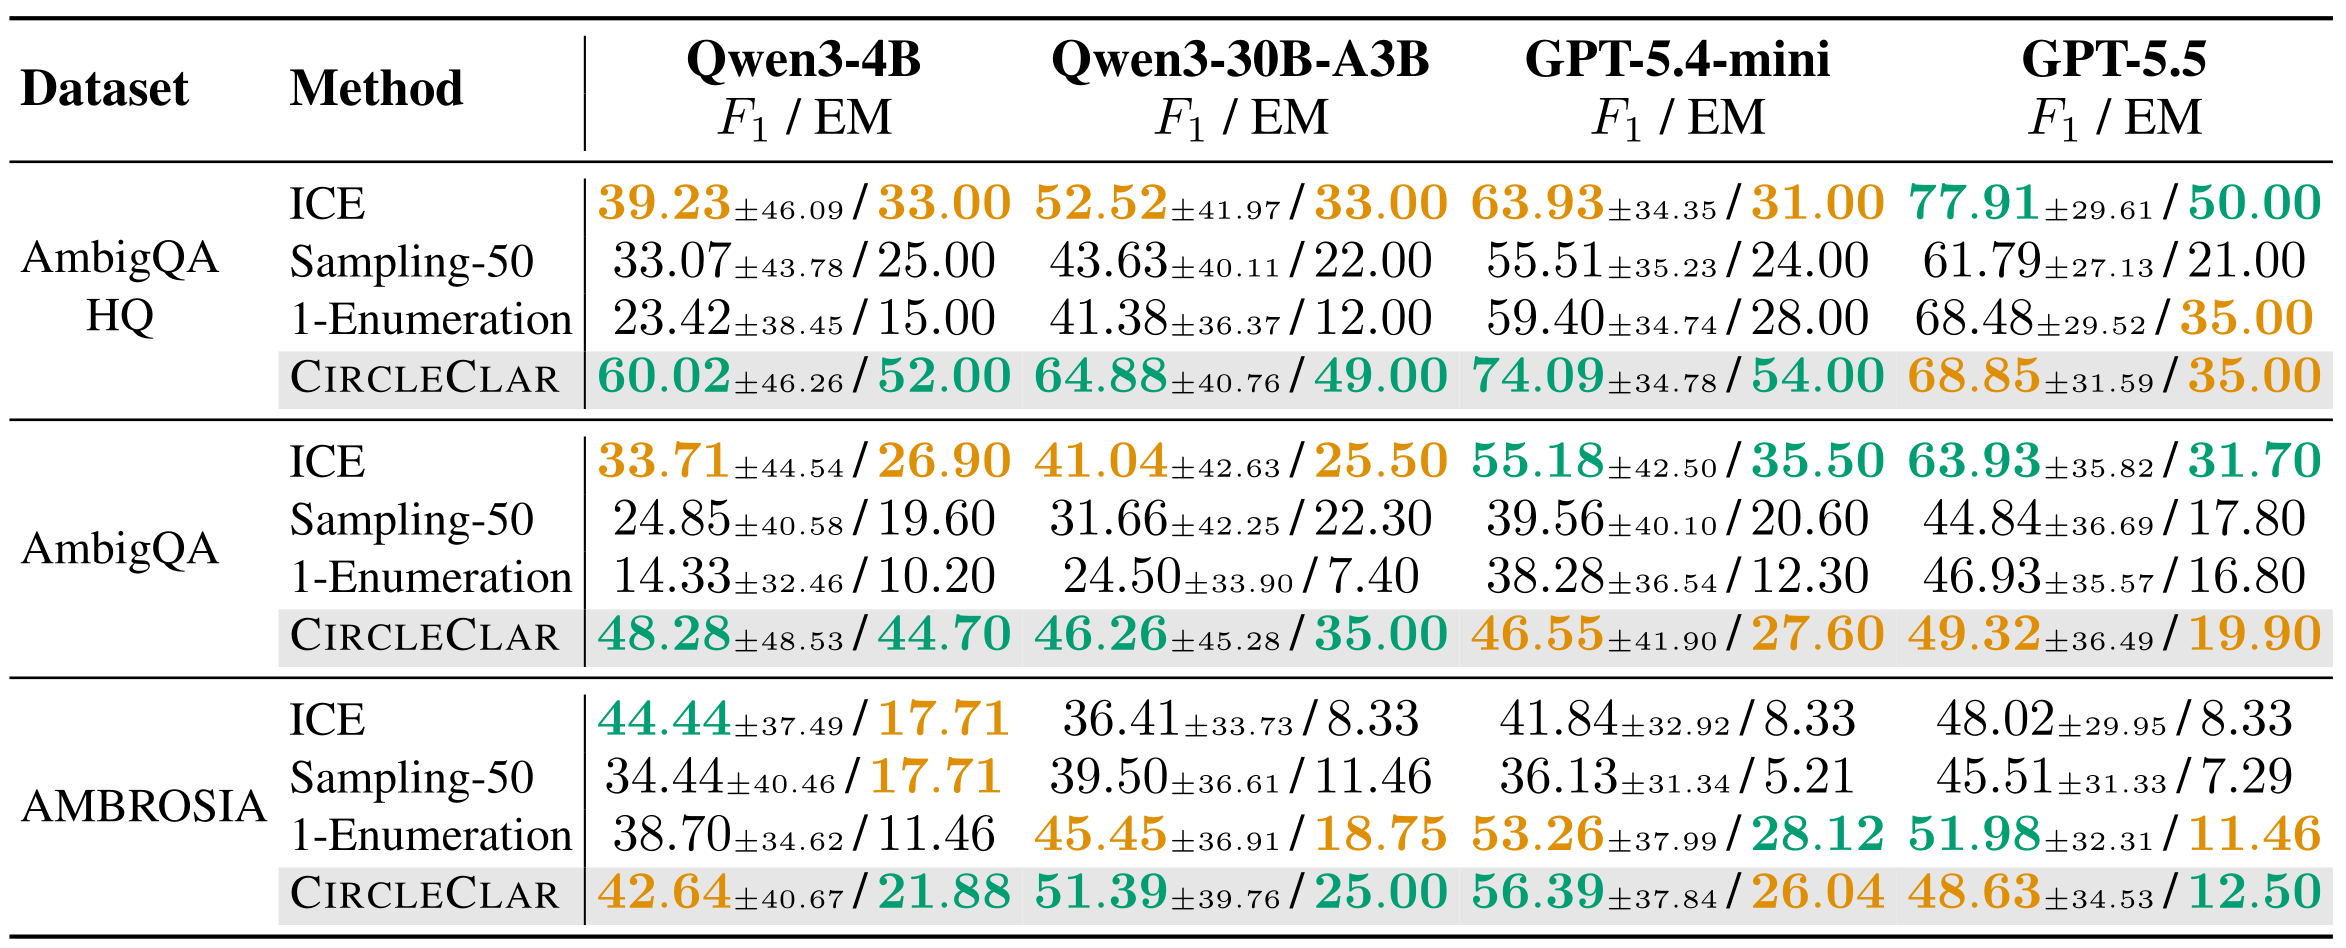
What we measure. How closely each method recovers the model’s answer set M(x). Per question, set F1 scores the overlap between the predicted and the reference set; exact match (EM) counts questions where both sets are identical. Baselines: ICE with a threshold oracle-tuned per model and dataset, Sampling-50 (50 samples), and 1-Enumeration (asking once for all plausible answers). CircleClar uses a fixed τ = 0.6.
Swipe to see all models, or tap the table to enlarge →
| Dataset | Method | Qwen3-4B | Qwen3-30B-A3B | GPT-5.4-mini | GPT-5.5 |
|---|---|---|---|---|---|
| AmbigQA-HQ | ICE | 39.23 ± 46.09EM: 33.00% | 52.52 ± 41.97EM: 33.00% | 63.93 ± 34.35EM: 31.00% | 77.91 ± 29.61EM: 50.00% |
| Sampling-50 | 33.07 ± 43.78EM: 25.00% | 43.63 ± 40.11EM: 22.00% | 55.51 ± 35.23EM: 24.00% | 61.79 ± 27.13EM: 21.00% | |
| 1-Enumeration | 23.42 ± 38.45EM: 15.00% | 41.38 ± 36.37EM: 12.00% | 59.40 ± 34.74EM: 28.00% | 68.48 ± 29.52EM: 35.00% | |
| CircleClar | 60.02 ± 46.26EM: 52.00% | 64.88 ± 40.76EM: 49.00% | 74.09 ± 34.78EM: 54.00% | 68.85 ± 31.59EM: 35.00% | |
| AmbigQA | ICE | 33.71 ± 44.54EM: 26.90% | 41.04 ± 42.63EM: 25.50% | 55.18 ± 42.50EM: 35.50% | 63.93 ± 35.82EM: 31.70% |
| Sampling-50 | 24.85 ± 40.58EM: 19.60% | 31.66 ± 42.25EM: 22.30% | 39.56 ± 40.10EM: 20.60% | 44.84 ± 36.69EM: 17.80% | |
| 1-Enumeration | 14.33 ± 32.46EM: 10.20% | 24.50 ± 33.90EM: 7.40% | 38.28 ± 36.54EM: 12.30% | 46.93 ± 35.57EM: 16.80% | |
| CircleClar | 48.28 ± 48.53EM: 44.70% | 46.26 ± 45.28EM: 35.00% | 46.55 ± 41.90EM: 27.60% | 49.32 ± 36.49EM: 19.90% | |
| AMBROSIA | ICE | 44.44 ± 37.49EM: 17.71% | 36.41 ± 33.73EM: 8.33% | 41.84 ± 32.92EM: 8.33% | 48.02 ± 29.95EM: 8.33% |
| Sampling-50 | 34.44 ± 40.46EM: 17.71% | 39.50 ± 36.61EM: 11.46% | 36.13 ± 31.34EM: 5.21% | 45.51 ± 31.33EM: 7.29% | |
| 1-Enumeration | 38.70 ± 34.62EM: 11.46% | 45.45 ± 36.91EM: 18.75% | 53.26 ± 37.99EM: 28.12% | 51.98 ± 32.31EM: 11.46% | |
| CircleClar | 42.64 ± 40.67EM: 21.88% | 51.39 ± 39.76EM: 25.00% | 56.39 ± 37.84EM: 26.04% | 48.63 ± 34.53EM: 12.50% |
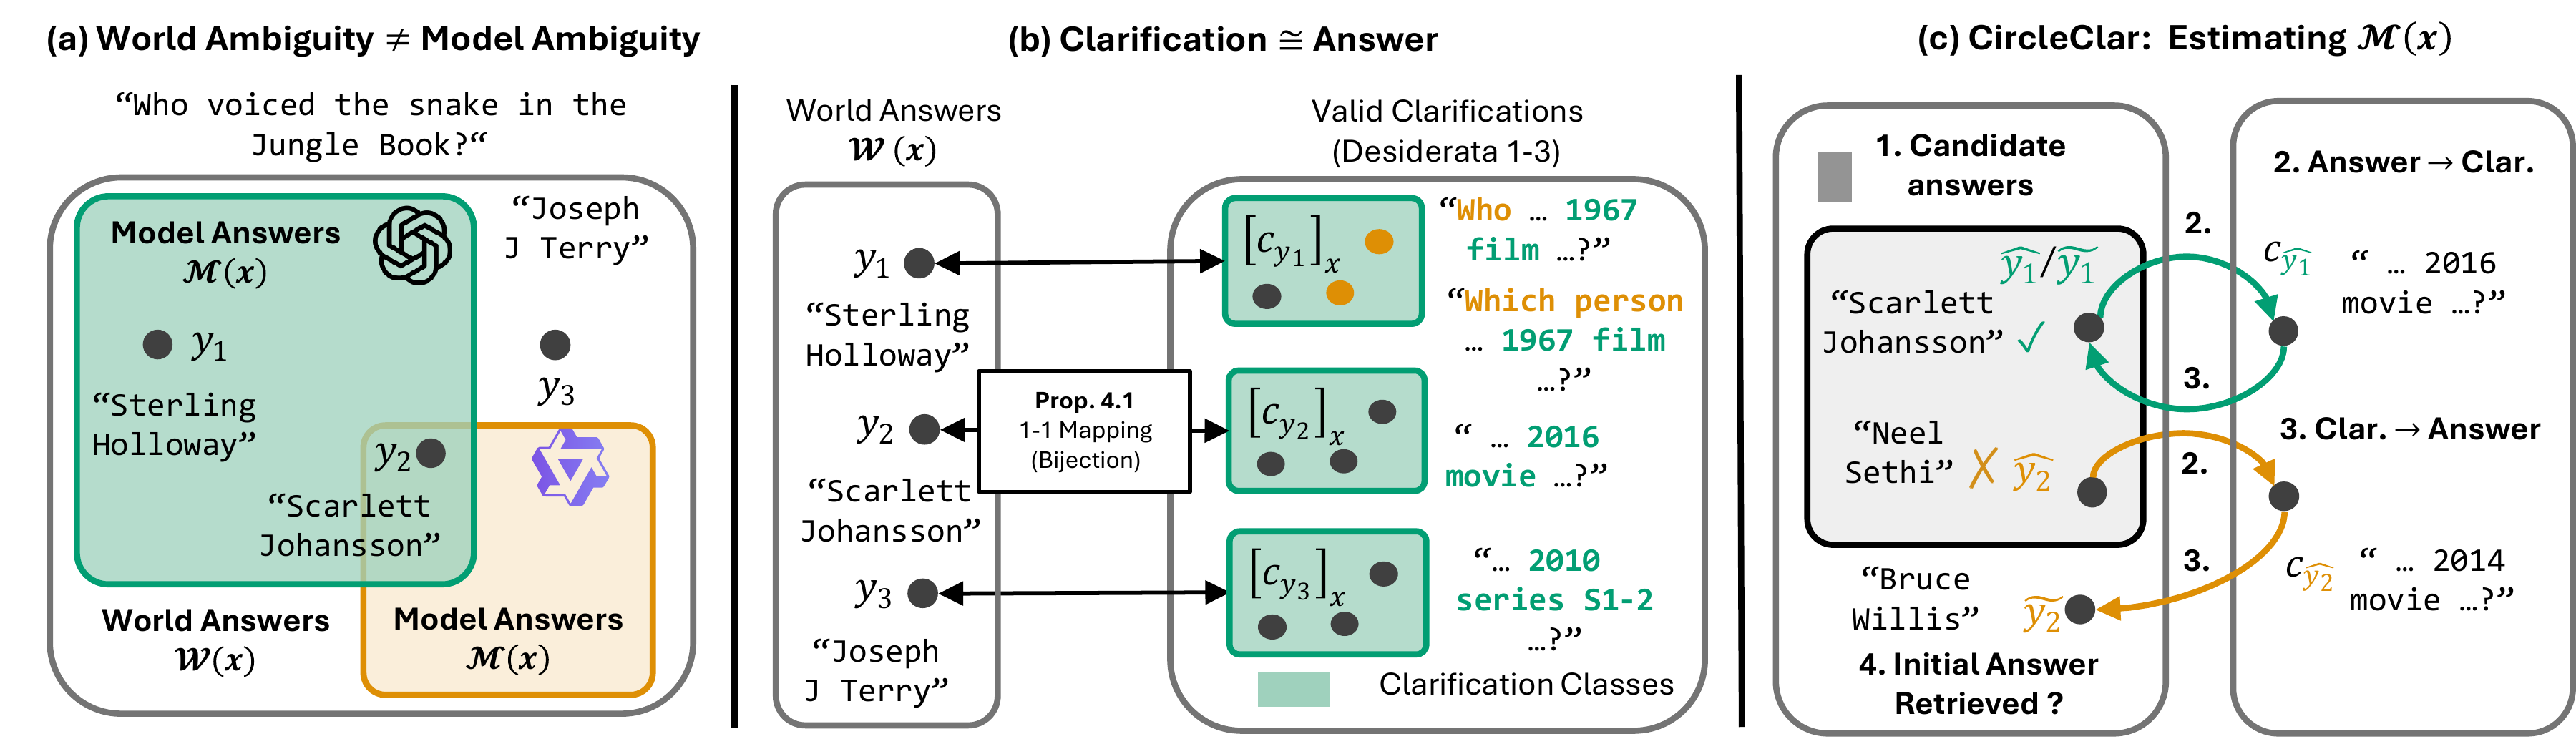
CircleClar performs strongly across datasets, achieving particularly large gains over baselines on smaller models and on the curated AmbigQA-HQ benchmark. Most of the gain comes from precision: the consistency check removes candidates whose cycle does not close, like Neel Sethi in the method demo. As models grow, they propose fewer invalid candidates and the gap to simple enumeration narrows.
See the paper for experimental setup and consistency-filtering analysis.